HP 8569B Spectrum Analyzer
GPIB Software
I've written a program to capture screen images from an HP 8569B spectrum analyzer (an early-80s analyzer that covers from 10MHz to 22GHz). This program runs under the Linux operating system using the LinuxGpib driver and interface library, and the perl programming language.
The screen capture software generates a PNG format graphics file that more or less matches what you see on the screen, with a few extra features. There is currently the ability to mark and annotate the peak signal in the display; I plan to extend this to allow marking both the max and the min signals, and display the delta between the two.
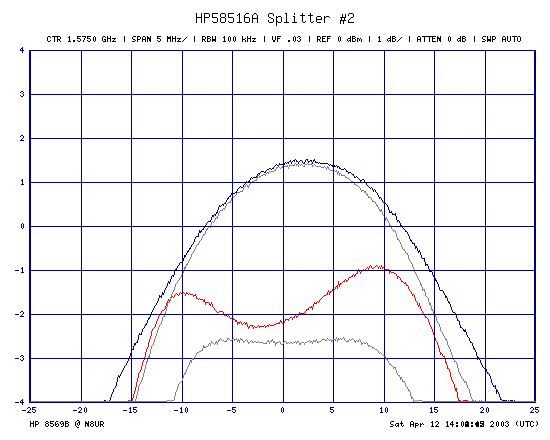
You can also choose multiple colors for the trace, and force the output image to be transparent. Used together, those features mean that you can use Photoshop or the Gimp to "stack" several traces into a single image. Here's an example of a stacked trace:
These programs are available at ftp://ftp.febo.com/pub/n8ur_programs. I'm not putting precise links here because the filenames are likely to change for a while yet.