Tektronix TDS-10xx/20xx Oscilloscope
GPIB Software
I recently acquired a Tektronix TDS-2012 digital storage oscilloscope (which is a really cool device; compared to the other scopes I've owned which date from the mid-80s or earlier, its capabilities are remarkable). I wanted to be able to capture screens from the scope, and decided to use the opportunity to learn a new programming language. So, this simple capture program is written in Python. I wrote and tested it under the the Linux operating system using the LinuxGpib driver and interface library. It ought to work with other scopes in the TDS-10xx and TDS-20xx families.
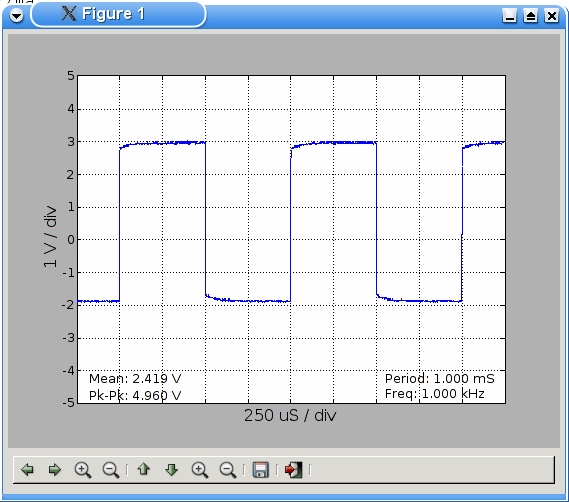
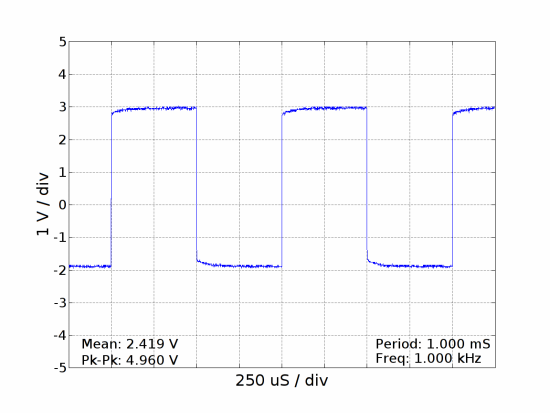
So far, the program is pretty basic, but it does a nice job of displaying a single trace. It also measures and displays (if applicable) the waveform's peak-to-peak and mean voltages, the signal frequency, and its period.
In addition to the linux-gpib driver and interface library, this program requires the MatPlotLib Python graphing module. The on-screen display requires the X window system, but it should be possible to modify the code to simply create a PNG file without requiring any display graphics.
The source code is available at ftp.febo.com/pub/n8ur_programs. I'm not putting precise links here because the filenames are likely to change for a while yet, but look for something like "tds2012.py".
Here are some examples of output from the screen capture program.