SDR-1000 Frequency Stability (Standard Oscillator)
I measured the frequency stability of the SDR-1000's original Valpey-Fisher 200MHz crystal oscillator. I measured it "in the box" by sampling the output of the AD9854 DDS chip with the SDR-1000 operating at 50MHz.The measurements were taken by an HP5370B frequency counter driven by an HP 5065A Rubidium frequency standard. I took frequency readings every five seconds and logged them to a disk file (well, *I* didn't take the readings; a software program communicating with the 5370B via the GPIB bus did the logging). I also measured the ambient temperature near the SDR-1000 enclosure using a Temp-Trax 2000 RS-232 thermometer. For the frequency vs. temperature plots, I measured the temperature at 1 minute intervals and used every 12th record from the frequency data to match that rate.
Before looking at the data, please realize that I'm a "time nut" and am looking far more closely at the performance of the SDR-1000 than is necessary for use in the real world. The overall frequency stability of the SDR-1000 is nothing to complain about unless you are operating with one of the relatively few digital modes that require very stable frequencies, in which case you'd need to add a temperature compensated crystal oscillator ("TCXO") to just about any radio to get the performance you need. The PowerSDR software allows you to easily calibrate the frequency to compensate for the oscillator's error, so the actual frequency error of the oscillator isn't an issue.
Also, remember that these are the results of testing one radio; others may have different performance.
That said, here are the results.
First, how long did it take the system to warm up and reach stability? From a cold start, this is what the first 60 minutes of operation looks like.
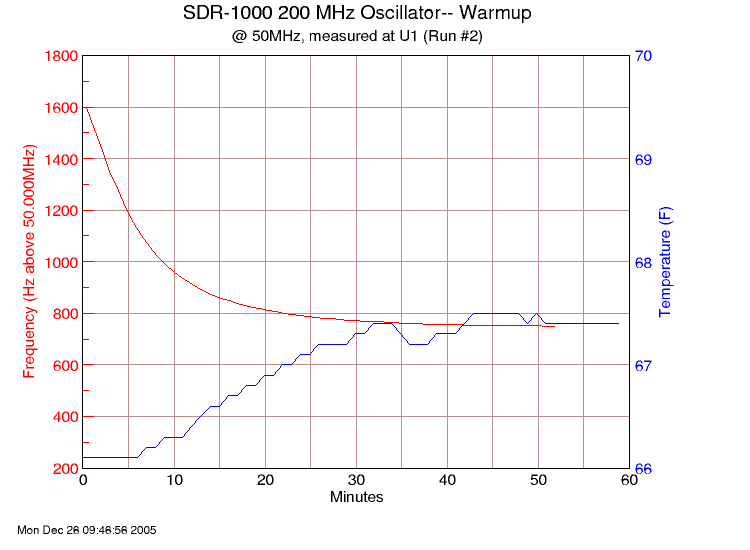
My SDR-1000 starts out about 1.6kHz high in frequency at 50MHz (that's 3.2x10⁻⁵, or 32ppm, high. Most of the warm-up drift occurs in the first 30 minutes after power-on. After 50 minutes, the frequency has stabilized and is now about 750 cycles high, which is 1.5x10⁵ or 15ppm, high.
You can see that the temperature increases during the warmup period and seems to stabilize as the frequency does. I believe that this is warming from the SDR-1000 itself. The temperature sensor (a very small, lightweight "nub" on the end of a piece of 24 gauge zip wire) was hanging about an inch off the side of the enclosure, and apparently was affected by the increasing temperature of the enclosure as the SDR-1000 warmed up.
Next, how stable is it after warm up? This is data taken after the SDR-1000 had been operating for over two hours.
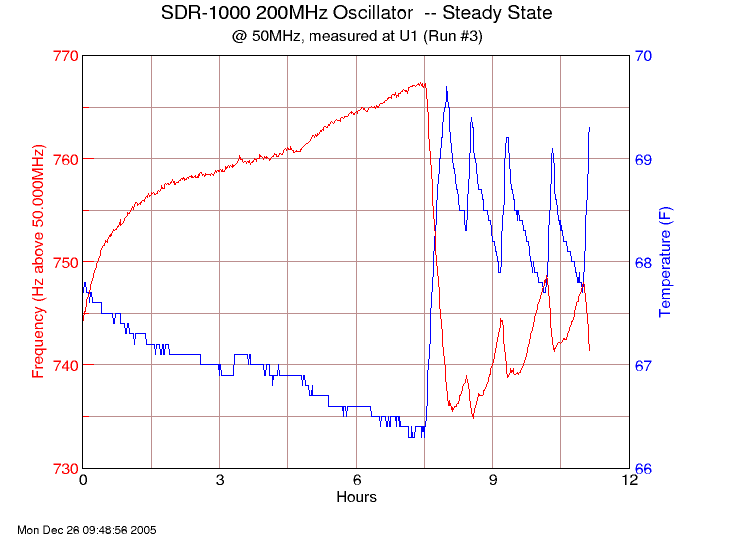
This was an overnight data run, and thanks to my setback thermostat we can clearly see the frequency versus temperature curve of the Valpey-Fisher oscillator. As the temperature gradually decreases overnight, the SDR-1000 frequency rises. Then, when the furnace (forced hot air) kicks on in the morning, there are sharp upward temperature spikes, matched by downward frequency shifts.
I wouldn't want to extrapolate this over too wide a temperature range, but there was about a 32Hz downward frequency shift for a 3.4 degree (F) temperature increase. That's -9.4Hz/degree at 50MHz, or -1.8x10⁻⁷/degree (0.18ppm). That's not bad at all for a non-compensated oscillator.
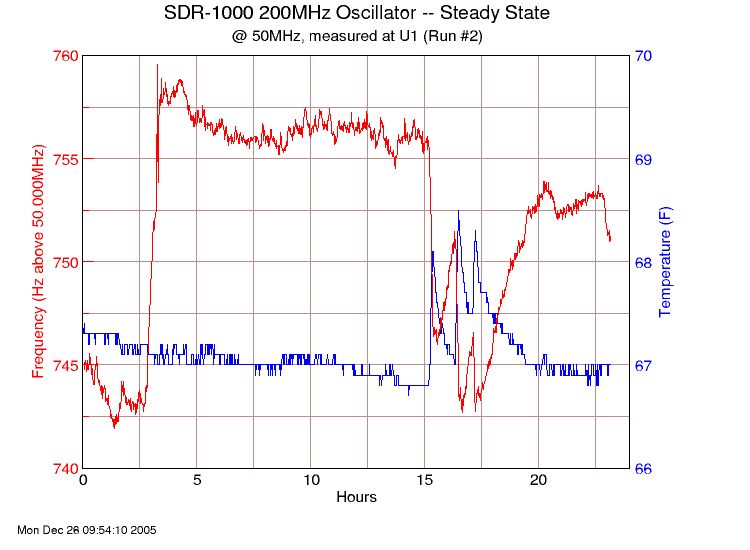
Here's a plot of another steady-state run. I'm including this mainly because of the interesting sharp upward frequency excursion for no apparent reason, followed by an approximately similar downward excursion when the furnace came on. Please note that we're talking about a jump of 15Hz at 50MHz, so this isn't some huge stability problem; most likely, it was a slight change in supply voltage, or perhaps just a physical "settling in" of the oscillator
Finally, a measure of frequency stability often used in the time and frequency community is the Allan Deviation. The Allan Deviation is somewhat like a standard deviation measurement over a sampling period. Here is a plot of the SDR-1000's stability (the warm up period was excluded) based on the "run 3" data shown above, with several hours of added data:
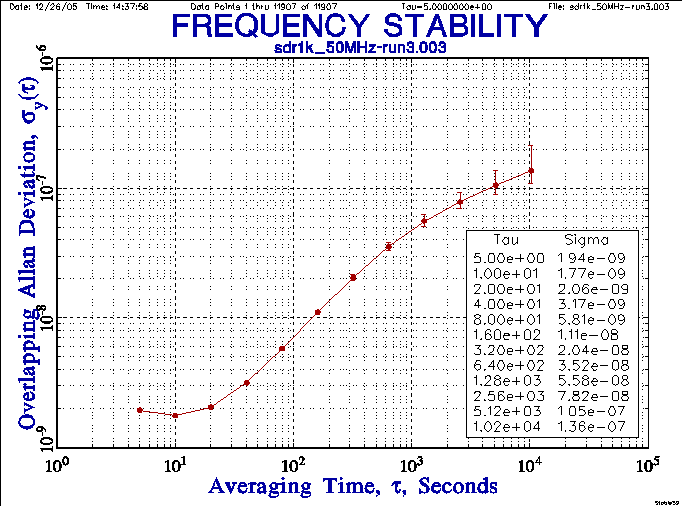
This shows the stability over sampling periods of 5 to 10,240 seconds. These results are pretty good. The shortest "tau" (sampling period) show better stability than the longer ones, mainly because of the temperature- related frequency excursions.