GPS Pulse-per-Second Comparative Noise
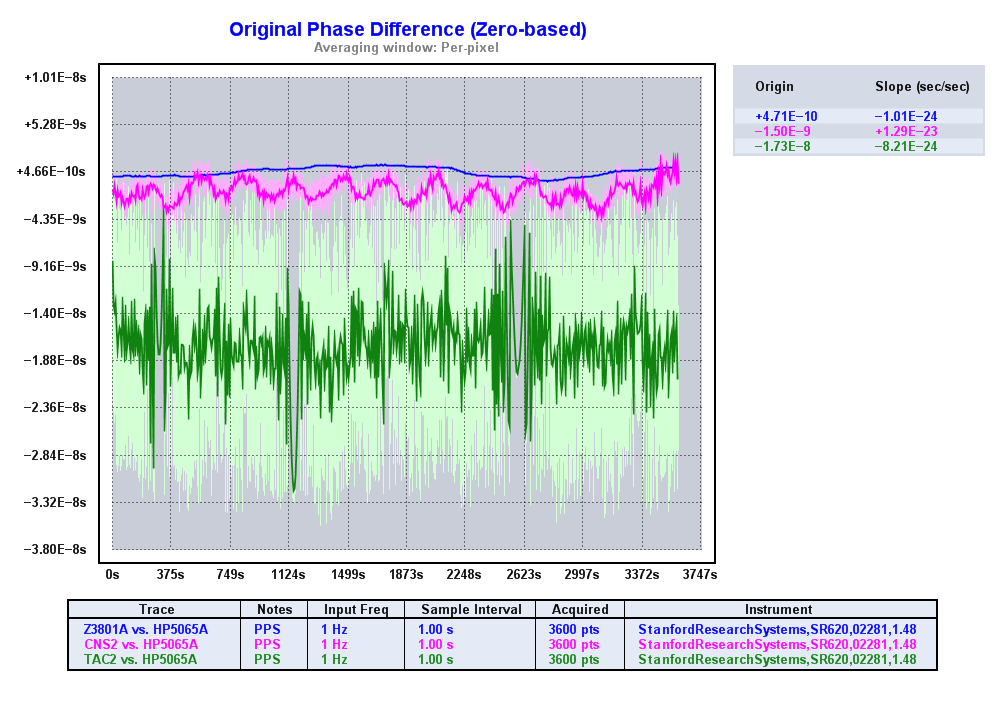
Thanks to John Miles' most excellent TimeLab software, it's absurdly easy to generate plots from many time interval counters. I currently have it hooked up to a Stanford Research SR-620 counter, and wanted to compare the relative noise of three different GPS sources in my lab: a Motorola M12+ with a TAPR TAC2 interface board; a CNS Clock II which also uses an M12+ but has some hardware enhancements that cause it to be much quieter than the M12+ by itself; and an HP Z3801A GPS disciplined oscillator (GPSDO) which uses a much older Motorola Oncore receiver as its GPS engine, but uses that to control a high quality double-oven crystal oscillator.I compared each one to the PPS output of an HP 5065A Rubidium frequency standard, collecting one hour's worth of readings for each. The point of the exercise was to look at the short term noise of each of these time sources; along the way we can see some interesting things, like the "hanging bridge" caused by the sawtooth effect in the M12+/TAC2 data, and how well the sawtooth correction in the CNS II clock works.
As you look at the data, it's important to note three things:
- The data wasn't collected simultaneously, so you can't compare specific points across the plots.
- The starting phase (Y axis) of each plot is arbitrary; you can't use this chart to determine the time difference between the clocks.
- I removed the linear drift caused by the HP 5065A reference being several parts in 10e12 off frequency.