The MVUS FMT:
December 2009 Measured Frequencies
Without further ado, these are the measured frequencies for the December 2009 Midwest VHF/UHF Society Frequency Measuring Test, averaged over the 48 hour test period:
| 80M | 3 583 129 | . | 500 656 787 | Hz | |
| 40M | 7 054 683 | . | 701 293 123 | Hz | |
| 20M | 14 055 260 | . | 902 576 32 | Hz | |
| 2M | 144 274 286 | . | 426 445 4 | Hz |
This measurement resolution is based on the 15 digit resolution of the frequency counter, plus the effect of averaging over 173K seconds. We used six decimal place (i.e., one microHertz) resolution in evaluating FMT entries; limited spreadsheet precision caused problems if we tried to use more than that.
Here are comments from the entrants.
Following is further information about the signals as transmitted.
Signal Source
The four transmitted signals were generated by PTS synthesizers with 0.1 Hertz resolution, driven by an FTS 4100/S12 cesium beam frequency standard. To reduce the number of zeros at the end of the frequency, the frequency of the FTS 4100 was deliberately offset. During the test period, the FTS 4100 frequency was continuously monitored against an HP Z3801A GPS disciplined oscillator to determine its frequency offset and stability.
Why not just use the GPSDO directly?
We used the cesium beam standard as the driver for the synthesizers, rather than the Z3801A, for two reasons.
First, we wanted the reference frequency to be slightly offset to extend the resolution of the test. The PTS synthesizers have 0.1 Hertz setting resolution and many of the FMT nuts can easily measure with that degree of precision and accuracy. Running the reference oscillator at an offset gives those folks more work to do by making the readings meaningful out into the microHertz range. It's not readily possible to offset the output of a GPSDO.
Second, while a GPS disciplined oscillator can have very good short term stability because of its high quality ovenized crystal oscillator, and excellent long term stability and accuracy because it is locked to the GPS system, at intermediate time ranges it has more noise than a cesium source. Using the cesium standard optimized the transmitted signal stability in the range of about 200 to 40,000 seconds of averaging.
And, of course, a third reason for using the cesium reference source is that it was a very cool thing to do!
Measurements
During the test period we compared the frequency of the FTS 4100 to the 10 MHz output of an HP Z3801A GPS disciplined oscillator using a Symmetricom TSC-5120A test set. The 5120A has a frequency counter with 13-15 digits of resolution over gate times of 1 to 1000 seconds. It also outputs a stream of relative phase comparisons that can be used to determine frequency stability.
The following graphs show the FTS 4100's frequency offset relative to the GPSDO, with 10 second and 1000 second counter gate times. The first chart shows the actual frequency, while the second shows the same data converted to a fractional frequency offset (in other words, the frequency error scaled to a nominal frequency of 1 Hertz).
(In all these measurements, it's important to remember that both the reference oscillator and the device under test contribute noise, and in some cases the reference (GPSDO) may be the noisier of the two. With GPSDO and cesium as the two sources, it's likely that for averaging times between about 200 and 40,000 seconds the GPSDO is the better source, while between those two points the cesium is quieter.)
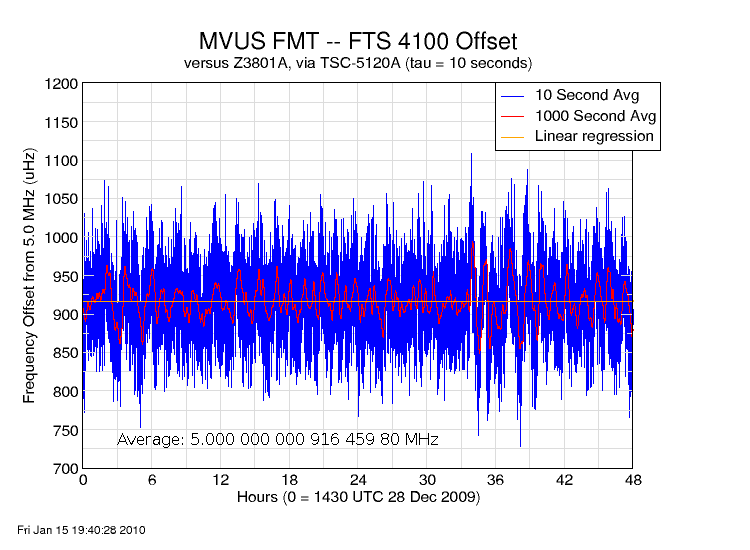
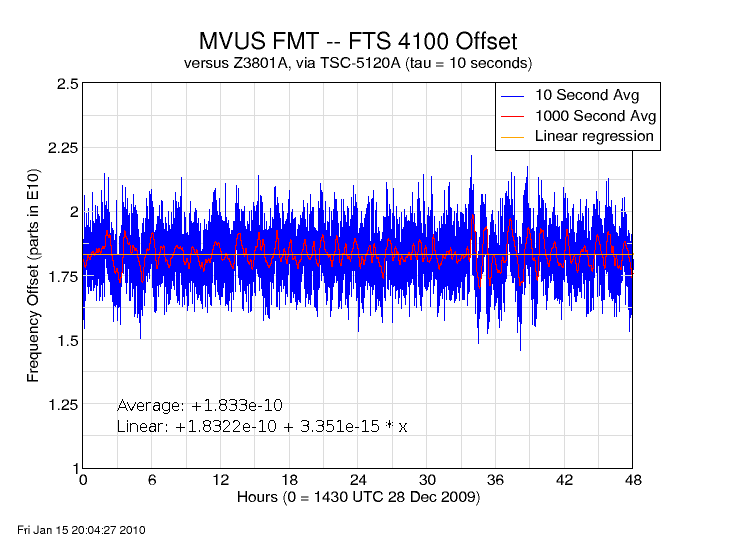
From these charts we can determine the average frequency of the FTS 4100. It was 0.000 916 459 80 Hertz above the nominal 5.000 MHz frequency. As a fractional frequency offset, that is +1.833x10⁻¹⁰.
It is obvious from the charts that there was some noise on the signal. All oscillators have noise, and a statistical measurement called the Allan Deviation is used to characterize this noise. The following chart shows the Allan Deviation measured for various averaging times over the 48 hour course of the transmission. The averaging time is shown (on a log scale) on the X axis, and the Allan Deviation on the Y axis. The Allan Deviation is something like a standard deviation; it tells you how much variance there will be between any two measurements at a specified interval.
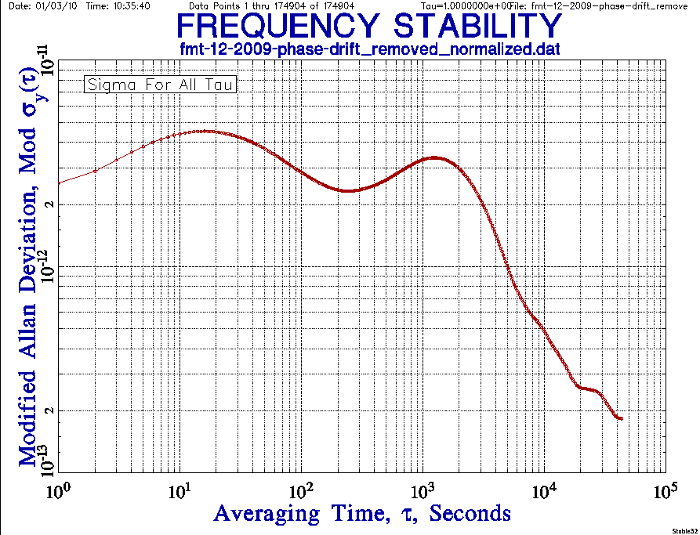
From this chart, we can say that the noise on the signal statistically won't exceed 5 parts in 1012 for any averaging time between 1 and about 40,000 seconds.
Another way to get a feel for the signal's stability is to think of the oscillators as a pair of clocks. After removing the rate difference (the frequency offset), the following chart shows the phase variations over the 48 hour period.
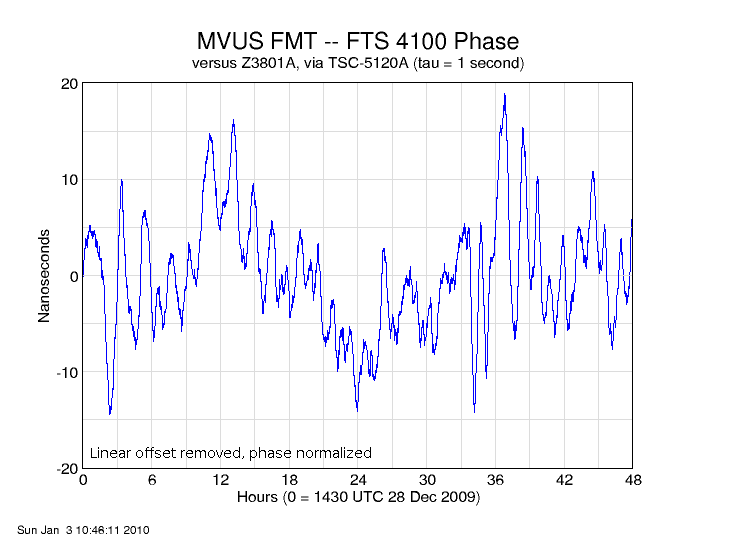
This chart, with data points 1 second apart, shows that once the offset is taken into account, the cesium and GPS "clocks" never varied from each other by more than nanoseconds over the 48 hours.
Finally, we measured the phase noise of the entire system -- frequency standard, synthsizer, buffer amplifier, and final amp -- on each of the three HF bands as well as the FTS 4100 itself. Those results are shown in the chart below.
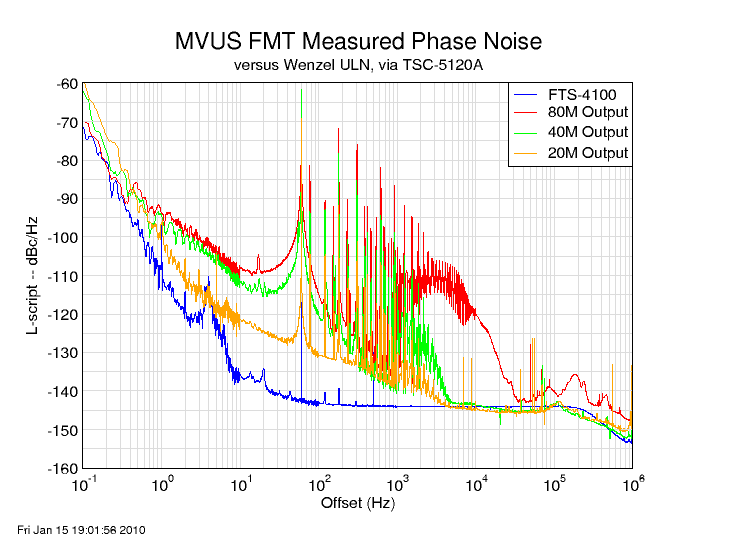
This shows how pure the transmitted signals were in the frequency domain. The X axis is the distance from the carrier frequency (in log format) and the Y axis shows the strength of the signal compared to the carrier.
From this we can see that on all three bands the energy was more than 90 dB down from an offset of one Hertz on out, other than a couple of spikes. The largest spur is at 60 Hertz and that comes from power supply noise. These spikes are a bit wider than expected, and that may be the result of a ground loop between the frequency generating equipment inside the house and the amplifiers in the garage.
The 80M signal looks quite different than those on 20 and 40. This is probably because the gain distribution and buffer amp were somewhat different on 80. While the shape of the plot is different, the on-air result should be very similar to the other bands since most of the energy is still at least 100 dB below the carrier.
Verification
N8UR measured the signals off-air from his station about three miles away. The following measurements are based on about 600 seconds of integration, and there is apparently a systematic bias that doesn't scale with frequency causing all results to come in a bit low. Most likely this has to do with the sound card sample rate error. But these provide a sanity check against the numbers above.
80M W8KSE 3 583 129.500 657 N8UR 3 583 129.500 082 (N8UR-W8KSE): -0.000 575 Hz -1.604e-10 40M W8KSE 7 054 683.701 293 N8UR 7 054 683.700 955 (N8UR-W8KSE): -0.000 338 Hz -4.791e-11 20M W8KSE 14 055 260.902 576 N8UR 14 055 260.902 256 (N8UR-W8KSE) -0.000 320 Hz -2.277e-11
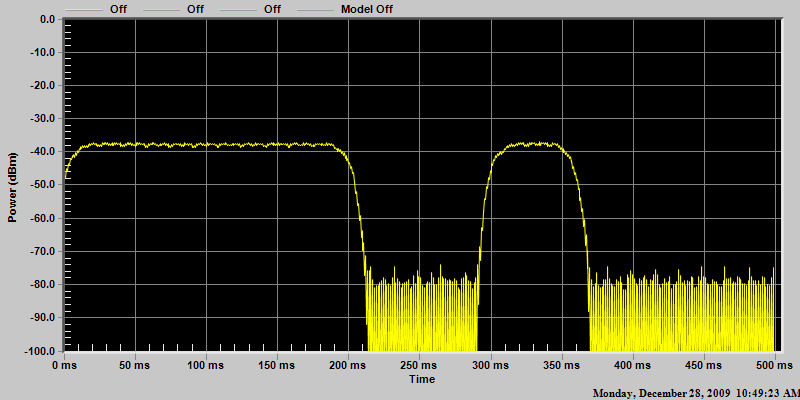
Keying Waveform
For fun, we measured the bandwidth of the morse code ID sequence. The following two plots are derived from a sound card spectrum analyzer program. Full size they are 1024 x 768 pixels; clicking on the smaller images should take you to the full-size version.
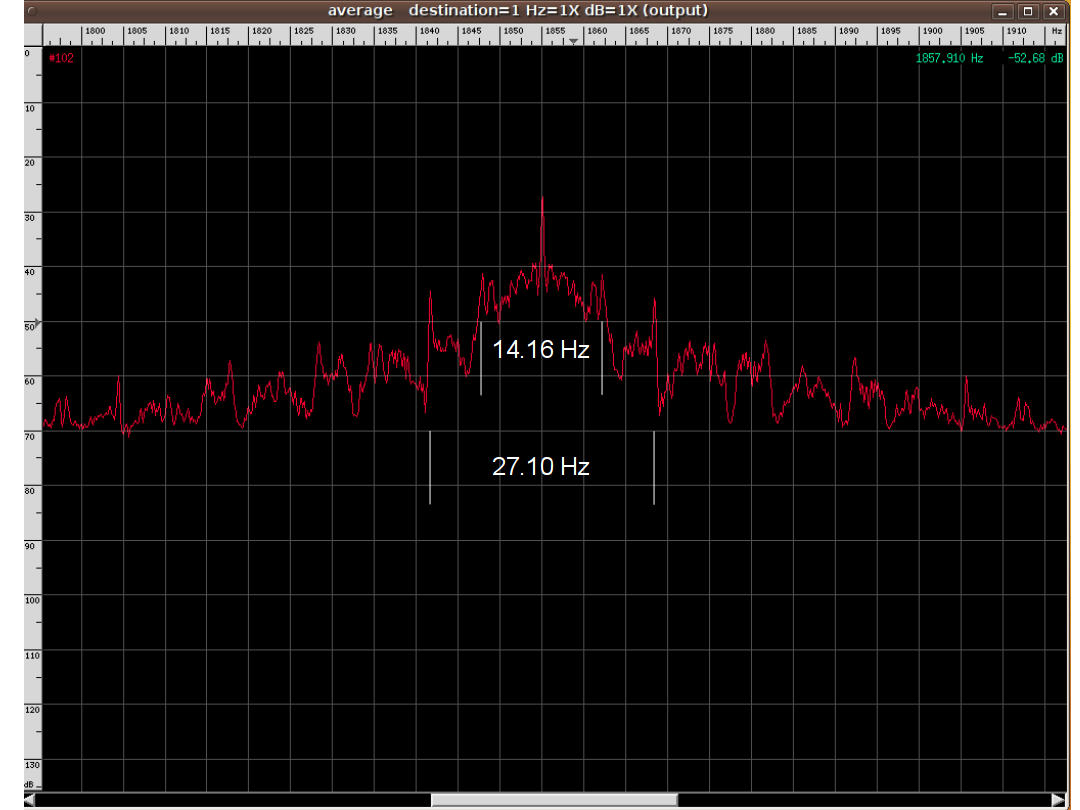
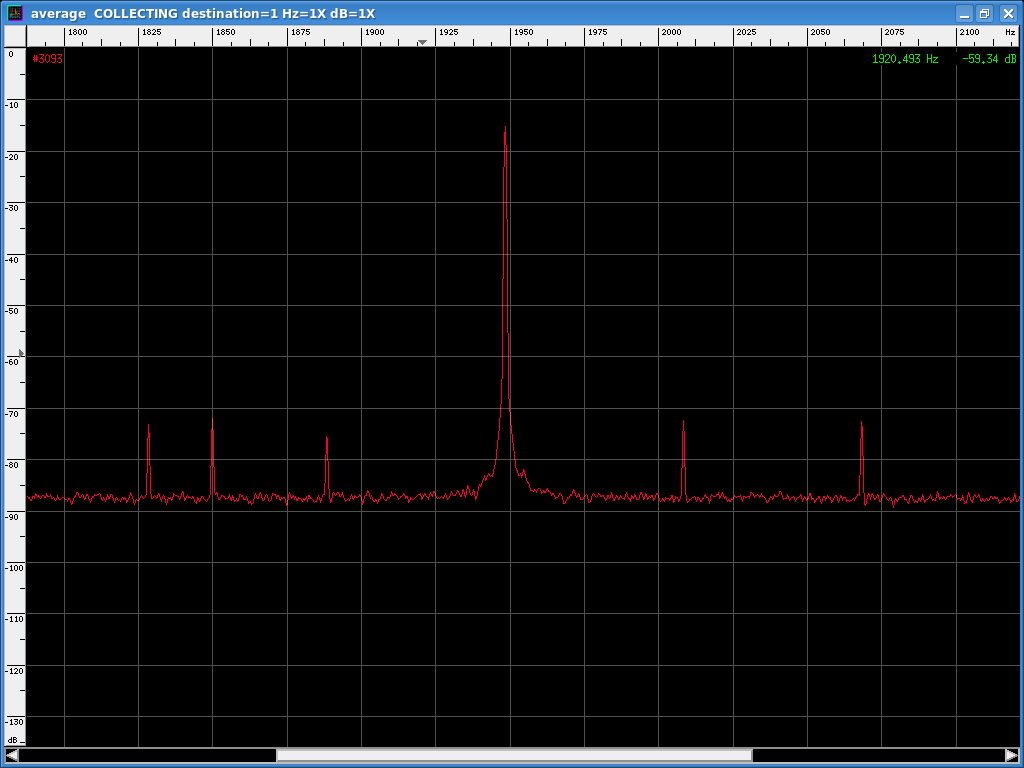
This is a time-domain capture of the waveform showing the keying rise time. We probably had a slower-than-optimal rise and fall on the signal elements.