Using the TSC-5120A Frequency Counter Function
The TSC-5120A Allan Deviation/Phase Noise Test Set outputs a stream of phase data that can be used for stability analysis. It also has phase and frequency difference strip chart displays. However, these cannot used to determine absolute frequency.
This is because the TSC adds an arbitrary phase offset as part of its processing so that phase always accumulates (i.e., the phase value will always increase from one data point to the next). As a result, the output phase data will not accurately show the true frequency offset between the device under test and the reference.
To get around this, the TSC-5120A has a "Frequency Counter" display screen that shows actual frequency (based on the reference frequency averaged over the last 1, 10, 100, and 1000 seconds. These frequency readings have impressive resolution -- 14 digits at 1 second, and 16 digits at 1000 seconds. You can remotely read the frequency counter data via ethernet.
While the frequency counter's performance is stellar, with real-world sources a 1000 second average may not be sufficient to get a true picture of the actual frequency. For example, to get full accuracy from a GSPDO averaging over a day or more is necessary.
It's not clear how best to extract longer term averages from the TSC frequency counter data. The averages appear to update more often than would be the case if they were truly independent (e.g., the 1000 second average updates every few seconds) so averaging the averages may not be wise.
I am trying to determine the best way to use the TSC frequency counter data for longer term averages. For this experiment I used two HP Z3801A GPSDOs. They had only been locked for several hours when I started, so there is probably more wander here than if both units had been in a stable state for weeks or months. But that may be helpful for this test.
I recorded the frquency counter data at 10 second intervals for about 16 hours. Here is a plot showing the 1, 10, 100, and 1000 second averages:
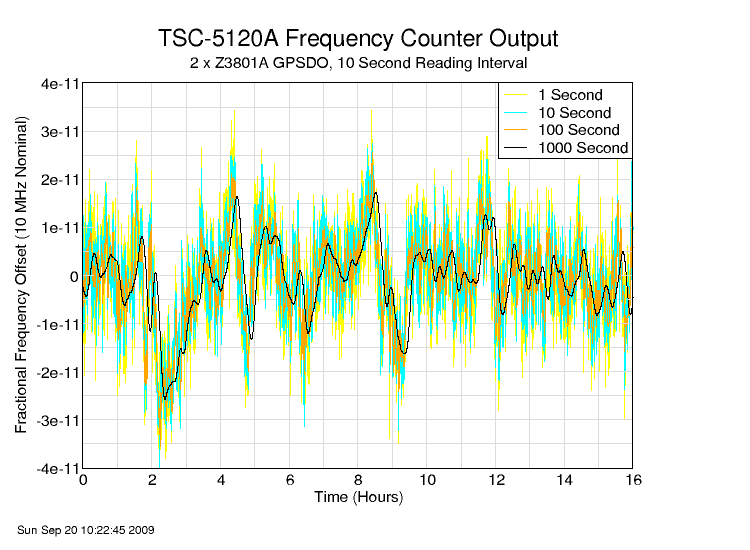
The three shorter averages all have significant noise; the 1000 second average is much quieter. However, if you look carefully you can see that the longer averages have a slight lag over the shorter ones. I suspect that the TSC is using some sort of running average algorthm. That means that the longer averages may not be reliable, and the 1 second reading should be the basis for further averaging.
I did a simple average of the data collected over the run:
| TSC Internal Averaging Time |
Average of All Readings |
| 1 Second | 7.6175e-12 |
| 10 Seconds | 6.8742e-12 |
| 100 Seconds | 6.0036e-12 |
| 1000 Seconds | 4.6363e-12 |
I think the TSC-'s averaging algorithm causes averages of the 10, 100, and 1000 second averages to be artificially low. For now, I'm going to use an average of the 1 second data for longer-term frequency offset measurements.