FMT 2005 Data Analysis
The ARRL was gracious enough to give me the raw data for the 2005 Frequency Measuring Test (scrubbed to protect the privacy of the entrants). I've started to do some analysis, and the results are here. This is a work in progress, so expect updates.
First, I did a simple statistical check of the results. Looking only at those stations that were within +/- 1Hz of of the frequency as measured at W1AW, I checked the mean, median, and standard deviation:
| Band | Mean | Median | STDEV | Data Points 160 | -0.45 | -0.42 | 0.31 | 38 | 80 | -0.05 | -0.09 | 0.33 | 64 | 40 | +0.02 | -0.01 | 0.47 | 42 | |
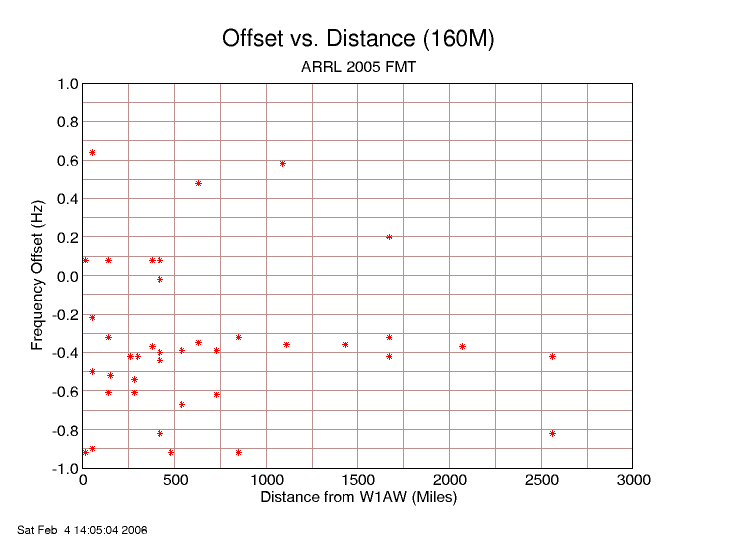
On 160M, the mean and median are both more than 0.4Hz below W1AW, and the reports were pretty tightly bunched (the standard deviation is the lowest of the three sets). The median is a bit above the mean. The scatter chart below confirms the impression that the measurements bunch at about -0.4Hz.
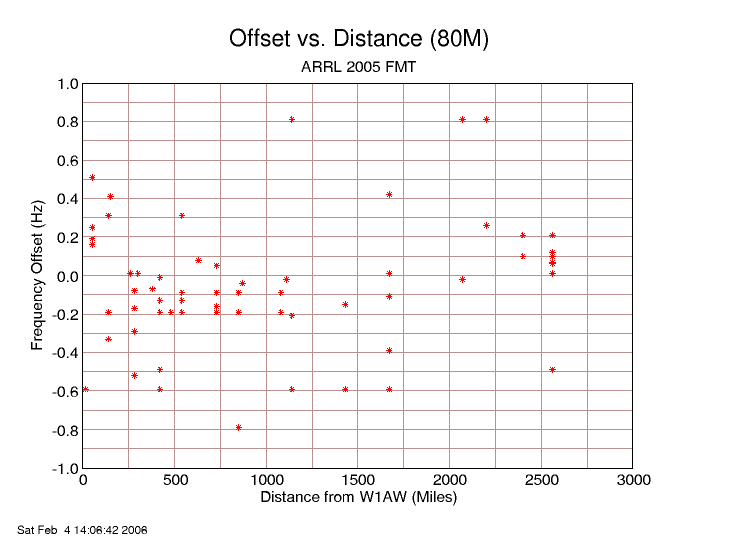
On 80M, the group is very close to the official frequency (mean of 0.05Hz low) but the median is lower than the mean and the zero point. The scatter chart gives a clear impression that the measurements cluster about 0.1Hz below the official frequency.
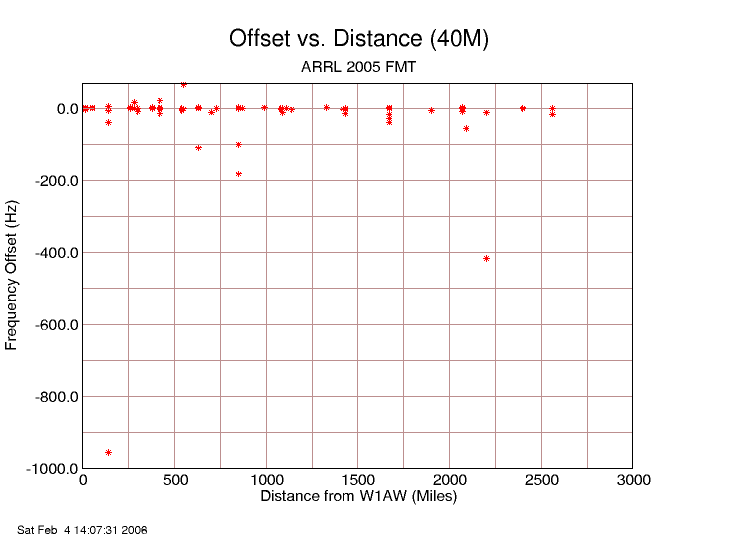
On 40M, the consensus value is just about right on the W1AW measurement -- the mean is only +0.02Hz, and the median is just a hair below both the zero point and the mean. The scatter chart confirms that there's no apparent bias above or below the zero point.
Notice that the standard deviation increases with frequency. This could be showing us that on the higher bands, skywave propagation was causing an increasing amount of wobble. Yet, despite the increased spread in the results, 40M gave the consensus that was closest to the W1AW measurement -- the median is almost an order of magnitude better than on 80.
Also note the number of stations that got within 1Hz -- there are a surprising number of folks out there who take the test seriously, and do a very good job at it!
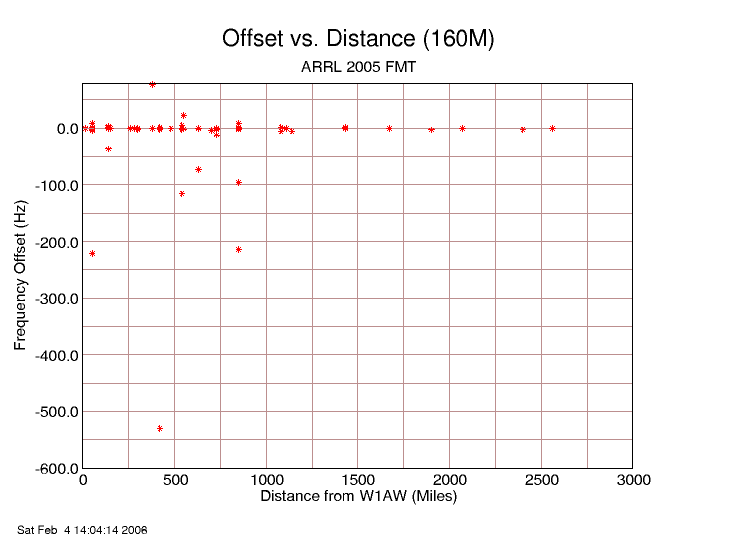
Next, I thought it would be interesting to see if the distance from the station had an impact on the accuracy of the results. Because the data had been stripped of addresses, I wasn't able to plot exact distances, but the data file did include the submitter's state, so I used that to come up with an approximation by measuring from Newington, CT, to roughly the geographic center of each state.
There are two scatter charts below for each band. One shows the full range of submitted data, while the other zooms in and shows only those stations that were within +/- 1Hz of the official frequency.
From an eyeball analysis, it looks as though distance doesn't have much impact on accuracy.