The Geekworks:
Data Plotting for Radioheads
Since virtually every project or experiment I undertake ends up being documented on the web, I've become interested in ways to turn instrument readings and analyzer displays into graphics files that I can display on a web page. My interest in time and frequency measurement involves logging data from frequency counters over long time periods, and that's added to my need to understand data acquisition. This page provides some details about how I do it; maybe it will be helpful to you.
I've organized it with information about data capture interfaces and hardware first, then a focus on GPIB/HPIB/IEEE-488 data capture software, and finally some information about capturing serial port data under Linux. Since my interest is primarily in Linux-based tools, most of the discussion, and almost all of the interesting stuff, is Linux-oriented.
Data Capture -- Hardware Interfaces
There are three primary hardware interfaces used for recording data from test equipment (well, five, really -- ethernet and USB have become common recently, but gear with those interfaces is too expensive for my budget.)The most common interface, particularly in instruments manufactured from the late 70's through the end of the 90's (i.e., a lot of the stuff that hams can afford to buy on the surplus market) is the GPIB (General Purpose Interface Bus, also known as HPIB after the company that developed it, and as IEEE-4888 after the standard that officially defined it) interface. My counters, digital meters, and spectrum analyzers all have GPIB.
GPIB interface cards for PCs are readily available on eBay. National Instruments is the biggest vendor, but you'll also find lots of old HP cards, and some other brands as well. Prices range from $50 or less for 8-bit, AT bus cards to $300 plus for PCMCIA cards. For typical ham uses, performance isn't critical, and the main issue in selecting a card is the kind of slot it plugs into, and whether your software has drivers to support it.
NI cards are widely supported under Windows, and you shouldn't have any problem using an NI card with any software you're likely to find (other than HP's ancient Rocky Mountain Basic).
National Instruments also has a Linux driver, but it doesn't support some of the early cards that you're likely to find on the web (it only works with the PCI bus and AT, Plug'n'Play, boards). The open source Linux GPIB package supports a wide variety of cards, including most NI and HP versions.
Gear built prior to the mid-70's is unlikely to have a standardized computer interface; there may be a parallel-bus interface, but you'll be really lucky if you can find a way to use it without homebrewing a lot of hardware. Units with an analog meter are likely to have an output designed to drive a chart recorder, and it's fairly easy to make use of this. It's usually a current output with 1 milliamp representing full-scale of the front-panel meter. You can capture data from this output with an analog-to-digital converter. I have an ADAC MF-5500 board that fits in an 16 bit AT slot and provides 8 channels of ADC with 12 bits of resolution, which is plenty for this application. The ADAC board came with Windows software, and I haven't yet figured out how to use it under Linux.
Another option is an external ADC like one I just got from B&B Electronics. Their model 232SDA12 has the same basic capability as the ADAC board -- 11 channels of 12 bit ADC, but is a dongle-sized external box with an RS-232 interface. At $59.95, it's a much cheaper solution, and the serial interface makes it easy to use under any operating system.
Some devices use a plain old serial port to send data. Those are easy :-) -- unless they use really odd serial port parameters like my Spectracom 8164, which only supports "mark" parity which isn't supported in the Linux serial port driver.
Software -- Low Level
Windows Software
When I started down this road, the computer I put together for data acquisition ran Windows 98. My goal was ultimately to use Linux for the job, and I've now made that transition. I'll talk a little bit about DOS/Windows tools, and then move on to the much more interesting (to me, at least) topic of Linux data acquisition and processing tools.The ADAC card card came with a simple Windows program, and had an optional more powerful program available for a reasonable cost. It can plot data directly, but I normally just log the data to a text file for later processing.
The HPIB card has more options, but unfortunately none of them are ideal. The classic software for data capture is LabView, but it costs bunches of money. Rumor has it there's a student version available for a reasonable price, but I've never been able to find it on their web site.
Stanford Research Systems has an interesting looking package called DDDA (Down and Dirty Data Analysis) which is only $99. I had trouble making it work properly with the old HP card I was using at that time, though.
I finally ended up finding a copy of HP's Basic For Windows, which is like taking a step back to 1981 -- it brings you all the power of the "BASICA" development environment in a window! But it actually works pretty well, once you get used to the awful editor commands. Here is a simple HP Basic program that I used to capture screen dumps from my HP 5869B spectrum analyzer (note that this program doesn't actually create any graphics; it just grabs data from the analyzer and stores it in a file for later processing).
Linux Software (Low Level)
Linux has decent support for GPIB cards. As noted above, National Instruments has a Linux driver available for their newer AT plug-n-play and PCI bus cards, and the open source Linux GPIB project supports a wide range of GPIB cards.NI and Linux GPIB each provide a library that interfaces to the driver and provides the functions needed to read and write data to devices on the bus. I discovered to my pain that you can't install both the NI and Linux GPIB packages at the same time; there are library name conflicts and Bad Things will happen if you do.
Perl is my preferred programming language, and there's a nice perl module called simply GPIB available from Jeff Mock. Jeff's module works with the NI driver and library, and may work with the Linux GPIB drivers, though it hasn't been tested against the current code and probably needs some tweaking to have a proper interface.
The Linux GPIB project code includes a perl module that provides a fairly low level interface to the standard GPIB programming functions; it's not as refined as Jeff's module, but it works. Since the cards I have are not all supported by the NI driver, I've been using the Linux GPIB driver, library, and perl module for my work.
Software -- Application Level
The work I'm doing divides into two categories. First, I do long-term logging of data values, such as frequency counter readings. Second, I want to dump the screen from my spectrum analyzers or oscilloscope to a graphics file for display on the web.Logging Applications
My strategy for frequency counters and similar devices is to use one program, normally a perl script running under Linux, to talk to the device, capture the data, and log it to a file; and a second program to process the data into something useful. Depending on the complexity, I use three different programming systems to analyze the data.
Spreadsheets
For simple applications, I use Excel or Openoffice, importing the data as ASCII text and then doing whatever manipulation is necessary. Here's a frequency stability graph generated this way (the source data is from my HP5340A microwave frequency counter, and was captured via HPIB using an HP Basic program):
Gnuplot and Grace
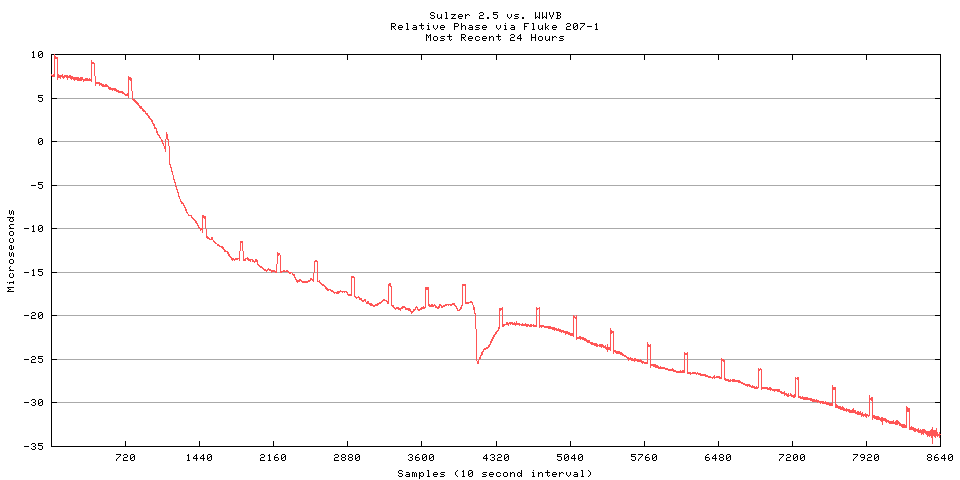
For more specialized plotting, or jobs I want to automate, I use a couple of Linux-based plotting programs. I started with "gnuplot" which is quite flexible, but somewhat hard to get your arms around. However, it does a very nice job once you figure it out. Here's a WWVB phase plot; the data was originally captured from a Fluke 207-1 receiver using the ADAC DAC card with Windows software:
Gnuplot is the standard *nix plotting software, but it's a bit limited. Another program called Grace is quite a bit more powerful, and has a WYSIWIG interface so that you can develop plots interactively and save the parameters for later use. Here's a plot generated from the serial port output of my Spectracom 8164 WWVB receiver:

Stable32
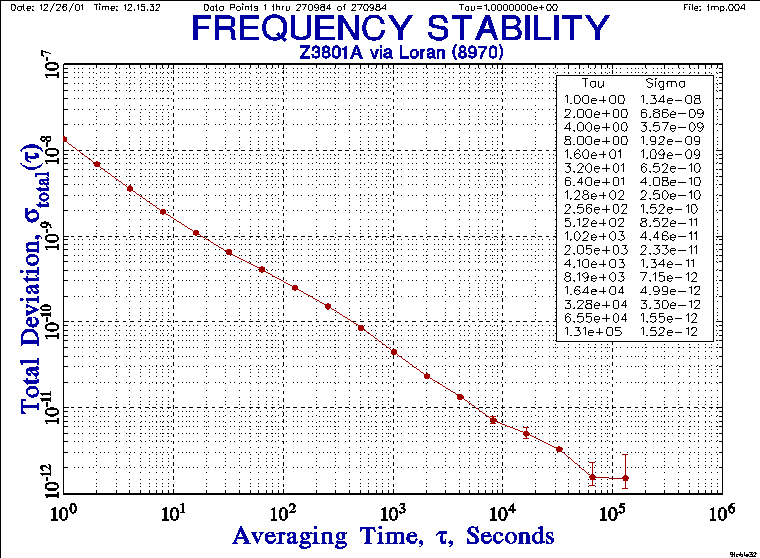
For serious frequency stability work, I use a great program called Stable32. It's very specialized and not cheap, but it does all the hard work necessary to turn frequency or phase data into stability charts and other tools useful for analyzing signal sources. Here's an example of Stable32's output:
Screen Capture Applications
My other main application is to dump the display from spectrum analyzers and oscilloscopes. My original method for doing this was pretty cumbersome, and involved doing the GPIB work under Windows, then using several Linux scripts and gnuplot to generate the output file. Now that I can talk to GPIB devices directly from Linux, I've combined all this into a single perl script. So far, I've pretty much completed programs for the HP 8569B and 3585B spectrum analyzers (though I'm continuing to tweak them). I've started on a program to capture screenshots from a TEK digital storage oscilloscope, but the Tek GPIB implementation is way different (and much more complicated) than the HP stuff I've been playing with, so I still hae a lot to do on that one.
Return to Geekworks Home
Return to febo.com Home